
February 25, 2021
- What does the size of a painting say about gender?
- Where on earth can you find the largest gemstones?
- How many artworks are on display versus in storage?
These questions, along with several others, were asked by Parsons School of Design students this past semester as they dove into the Smithsonian’s Open Access collections to illustrate their answers through the creation of stunning and thoughtful computer-generated infographics and visualizations.
The project began when professor Richard The reached out to inquire about a collaboration with the Parsons Masters of Data Visualization program for Fall 2020 semester. We were impressed by their previous collaborations, such as with the Metropolitan Museum of Art, and excited to see what interesting investigations the students would apply to the collections. The collaboration was also a natural fit for the purpose behind Open Access, placing the collections and data in the hands of students, educators, creatives, and technologists to build upon and create new knowledge, connections, and relevance.
“The partnership with the Smithsonian has been invaluable for our data visualization studio. The students worked with real data from an incredibly diverse set of collections, in close relationship with the curators, scientists, and data experts from each of the institutions. Given the incredible breadth of the data, they were able to tell their own stories in the form of qualitative and quantitative data visualizations, visual essays, and information graphics. We hope we can continue this collaboration in future classes.” - Richard The, Assistant Professor of Interaction Design, Parsons School of Design
As part of the Open Access launch, a set of developer tools was released, including an Application Programming Interface (API) hosted on data.gov and a GitHub data repository allowing platform integration and data access for students, researchers, programmers, and data scientists. The Parsons students used a variety of tools and data mining techniques in their projects, allowing them to dissect the Smithsonian collections and data in new ways and to apply their diverse backgrounds and interests to recontextualize the collections in engaging and dynamic visuals.
"It was so inspiring to see these students dig into an admittedly 'rough' data set but still develop inspiring experiments. Staff who attended the critiques have referenced some of the data visualizations since then, which shows me the value of allowing students in to experiment. The students' feedback will also be tremendously helpful as we refine the Smithsonian Open Access API." - Effie Kapsalis, Senior Digital Program Officer in the Smithsonian’s Office of the Undersecretary for Museums and Culture
Fifteen students worked over the course of fifteen weeks to develop their projects. Here are a few of our favorites:
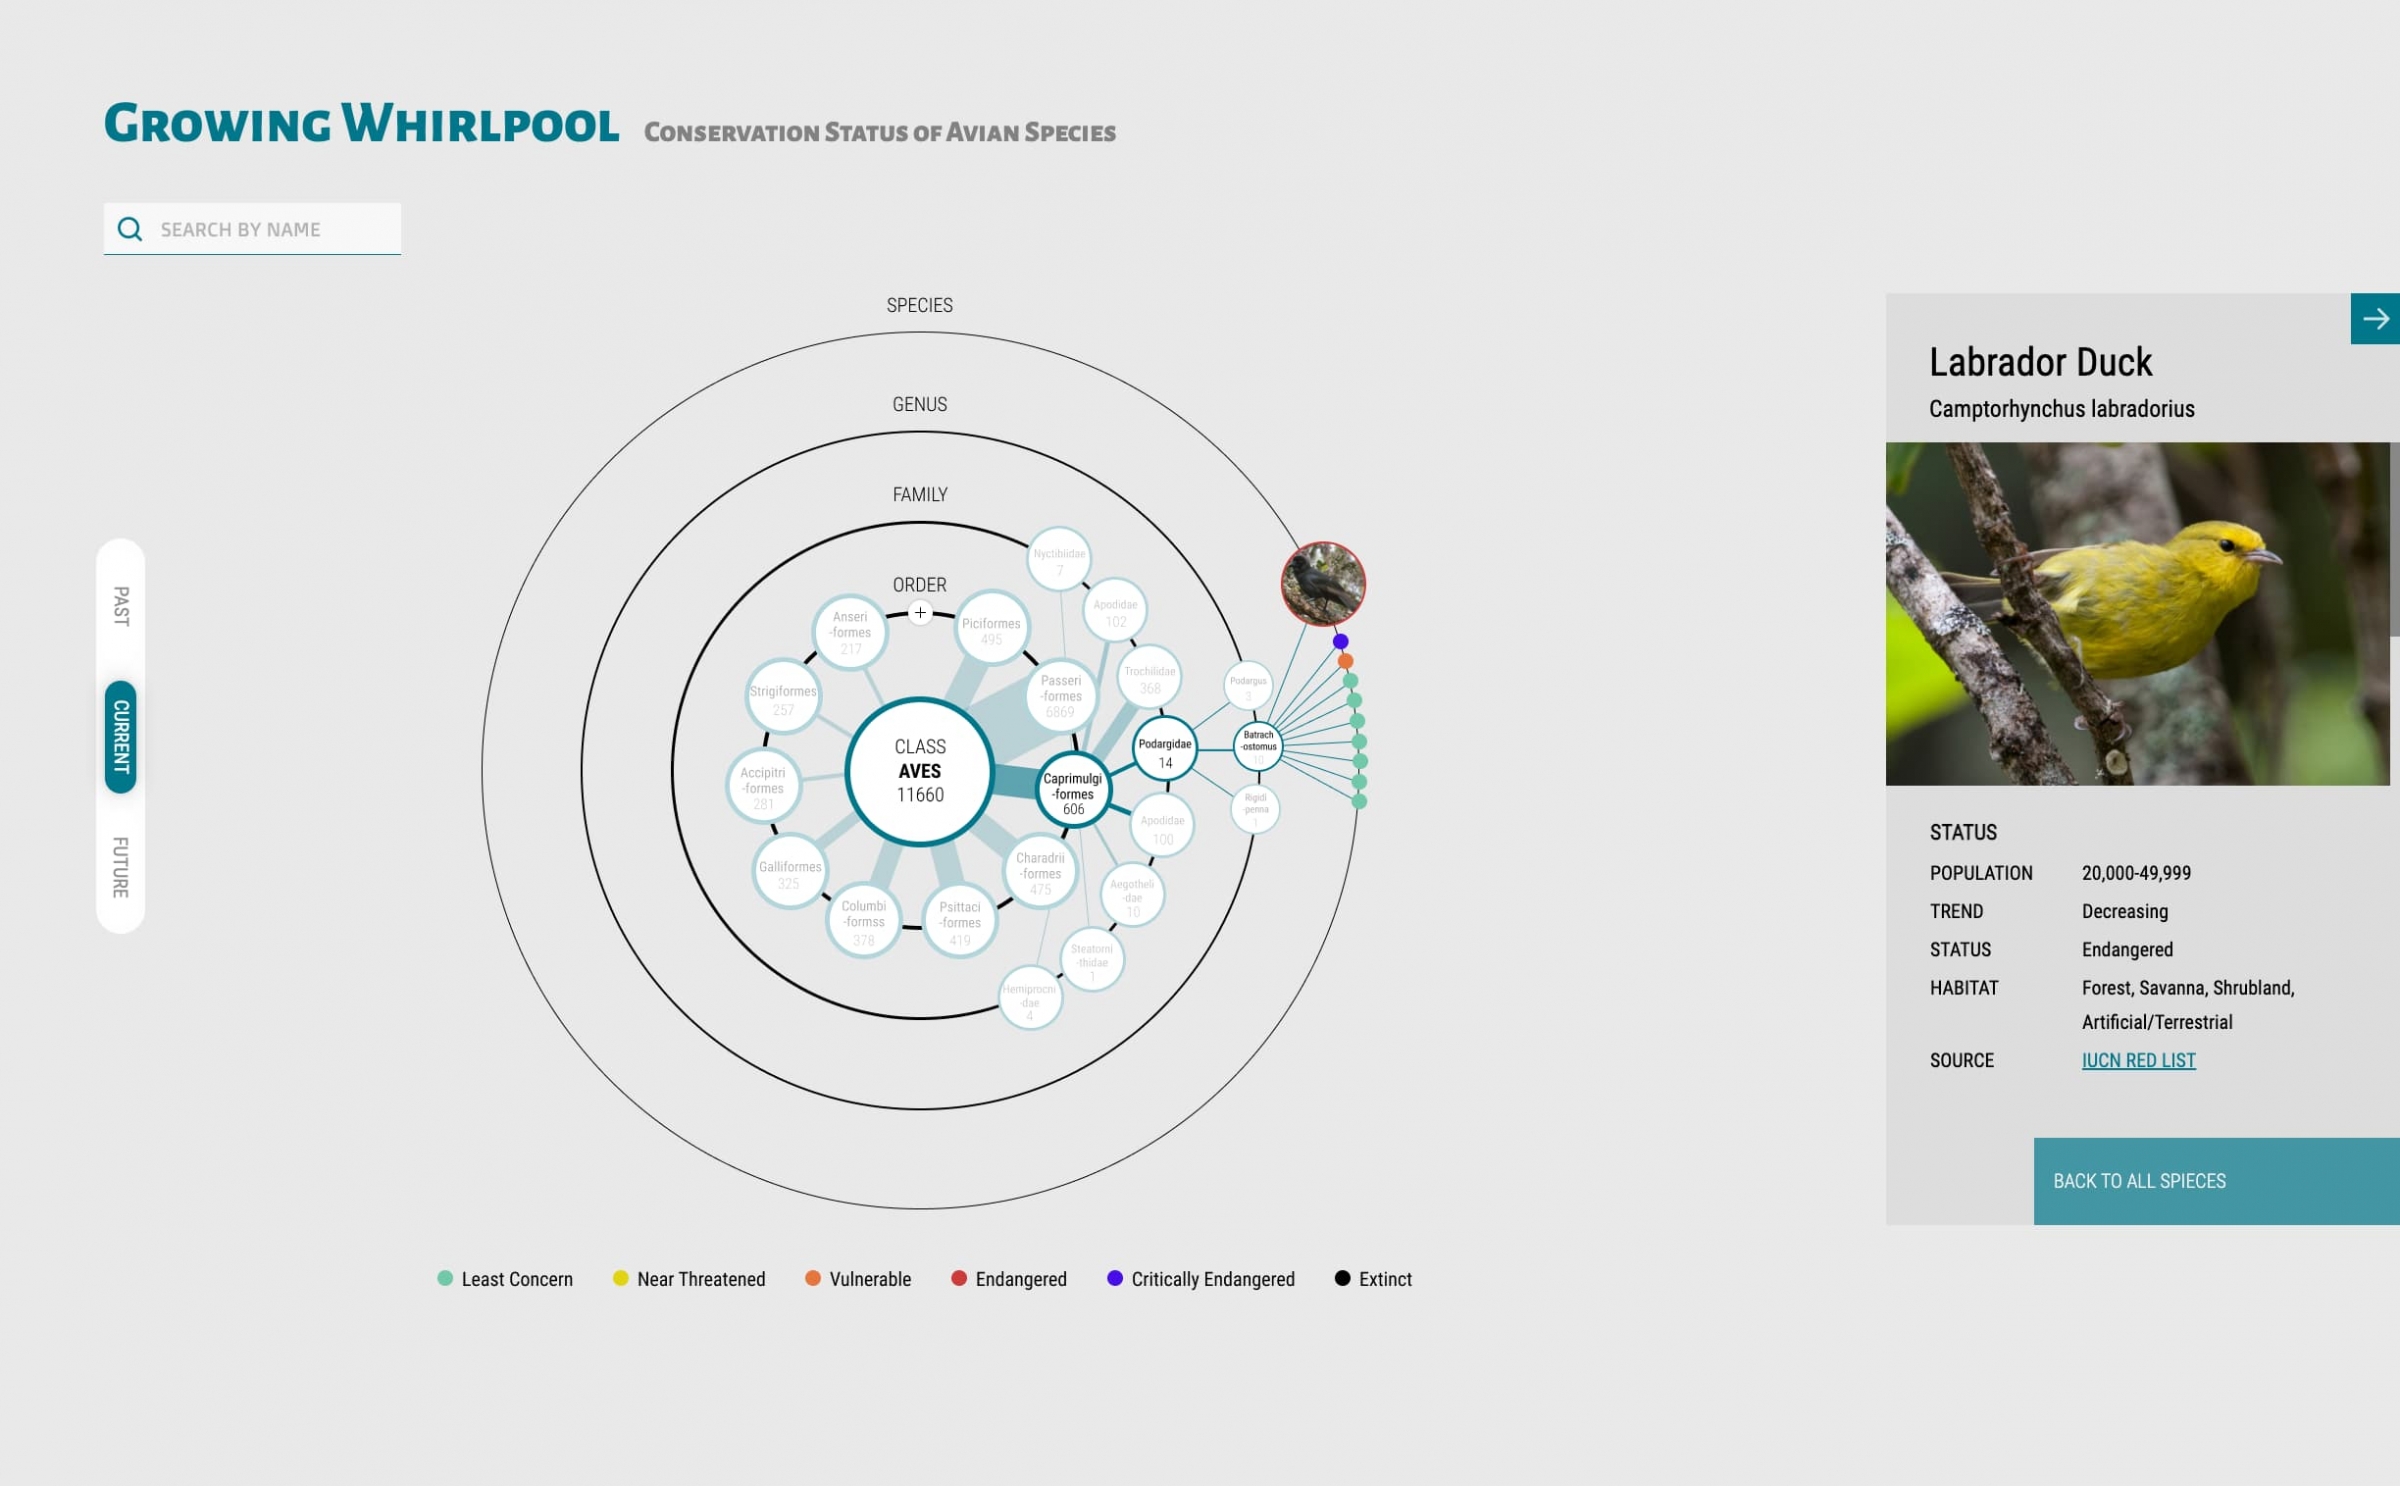
Growing Whirlpool: Conservation Status of Avian Species by Zhibang Jiang showcases the important, behind-the-scenes work the Smithsonian does on conservation and research.
The Face Value of Portraits by Inhye Lee examines whether the size of a portrait conveys anything about the social status or power of an individual.
“Before this project, I was not fully aware of the grand scale of the Smithsonian Institution. So I was initially surprised by the sheer size of the collection and the diverse member institutions. It was a bit overwhelming at first, but it was worth getting lost and finding serendipity.
Creating data visualizations with the Smithsonian Open Access initiative felt like experiencing what it may be like being a curator. Because I worked on this project at the peak of the pandemic, it also became a chance to think about how we may re-envision the experience of physically being at the museum when most people cannot travel to be there.” - Inhye Lee

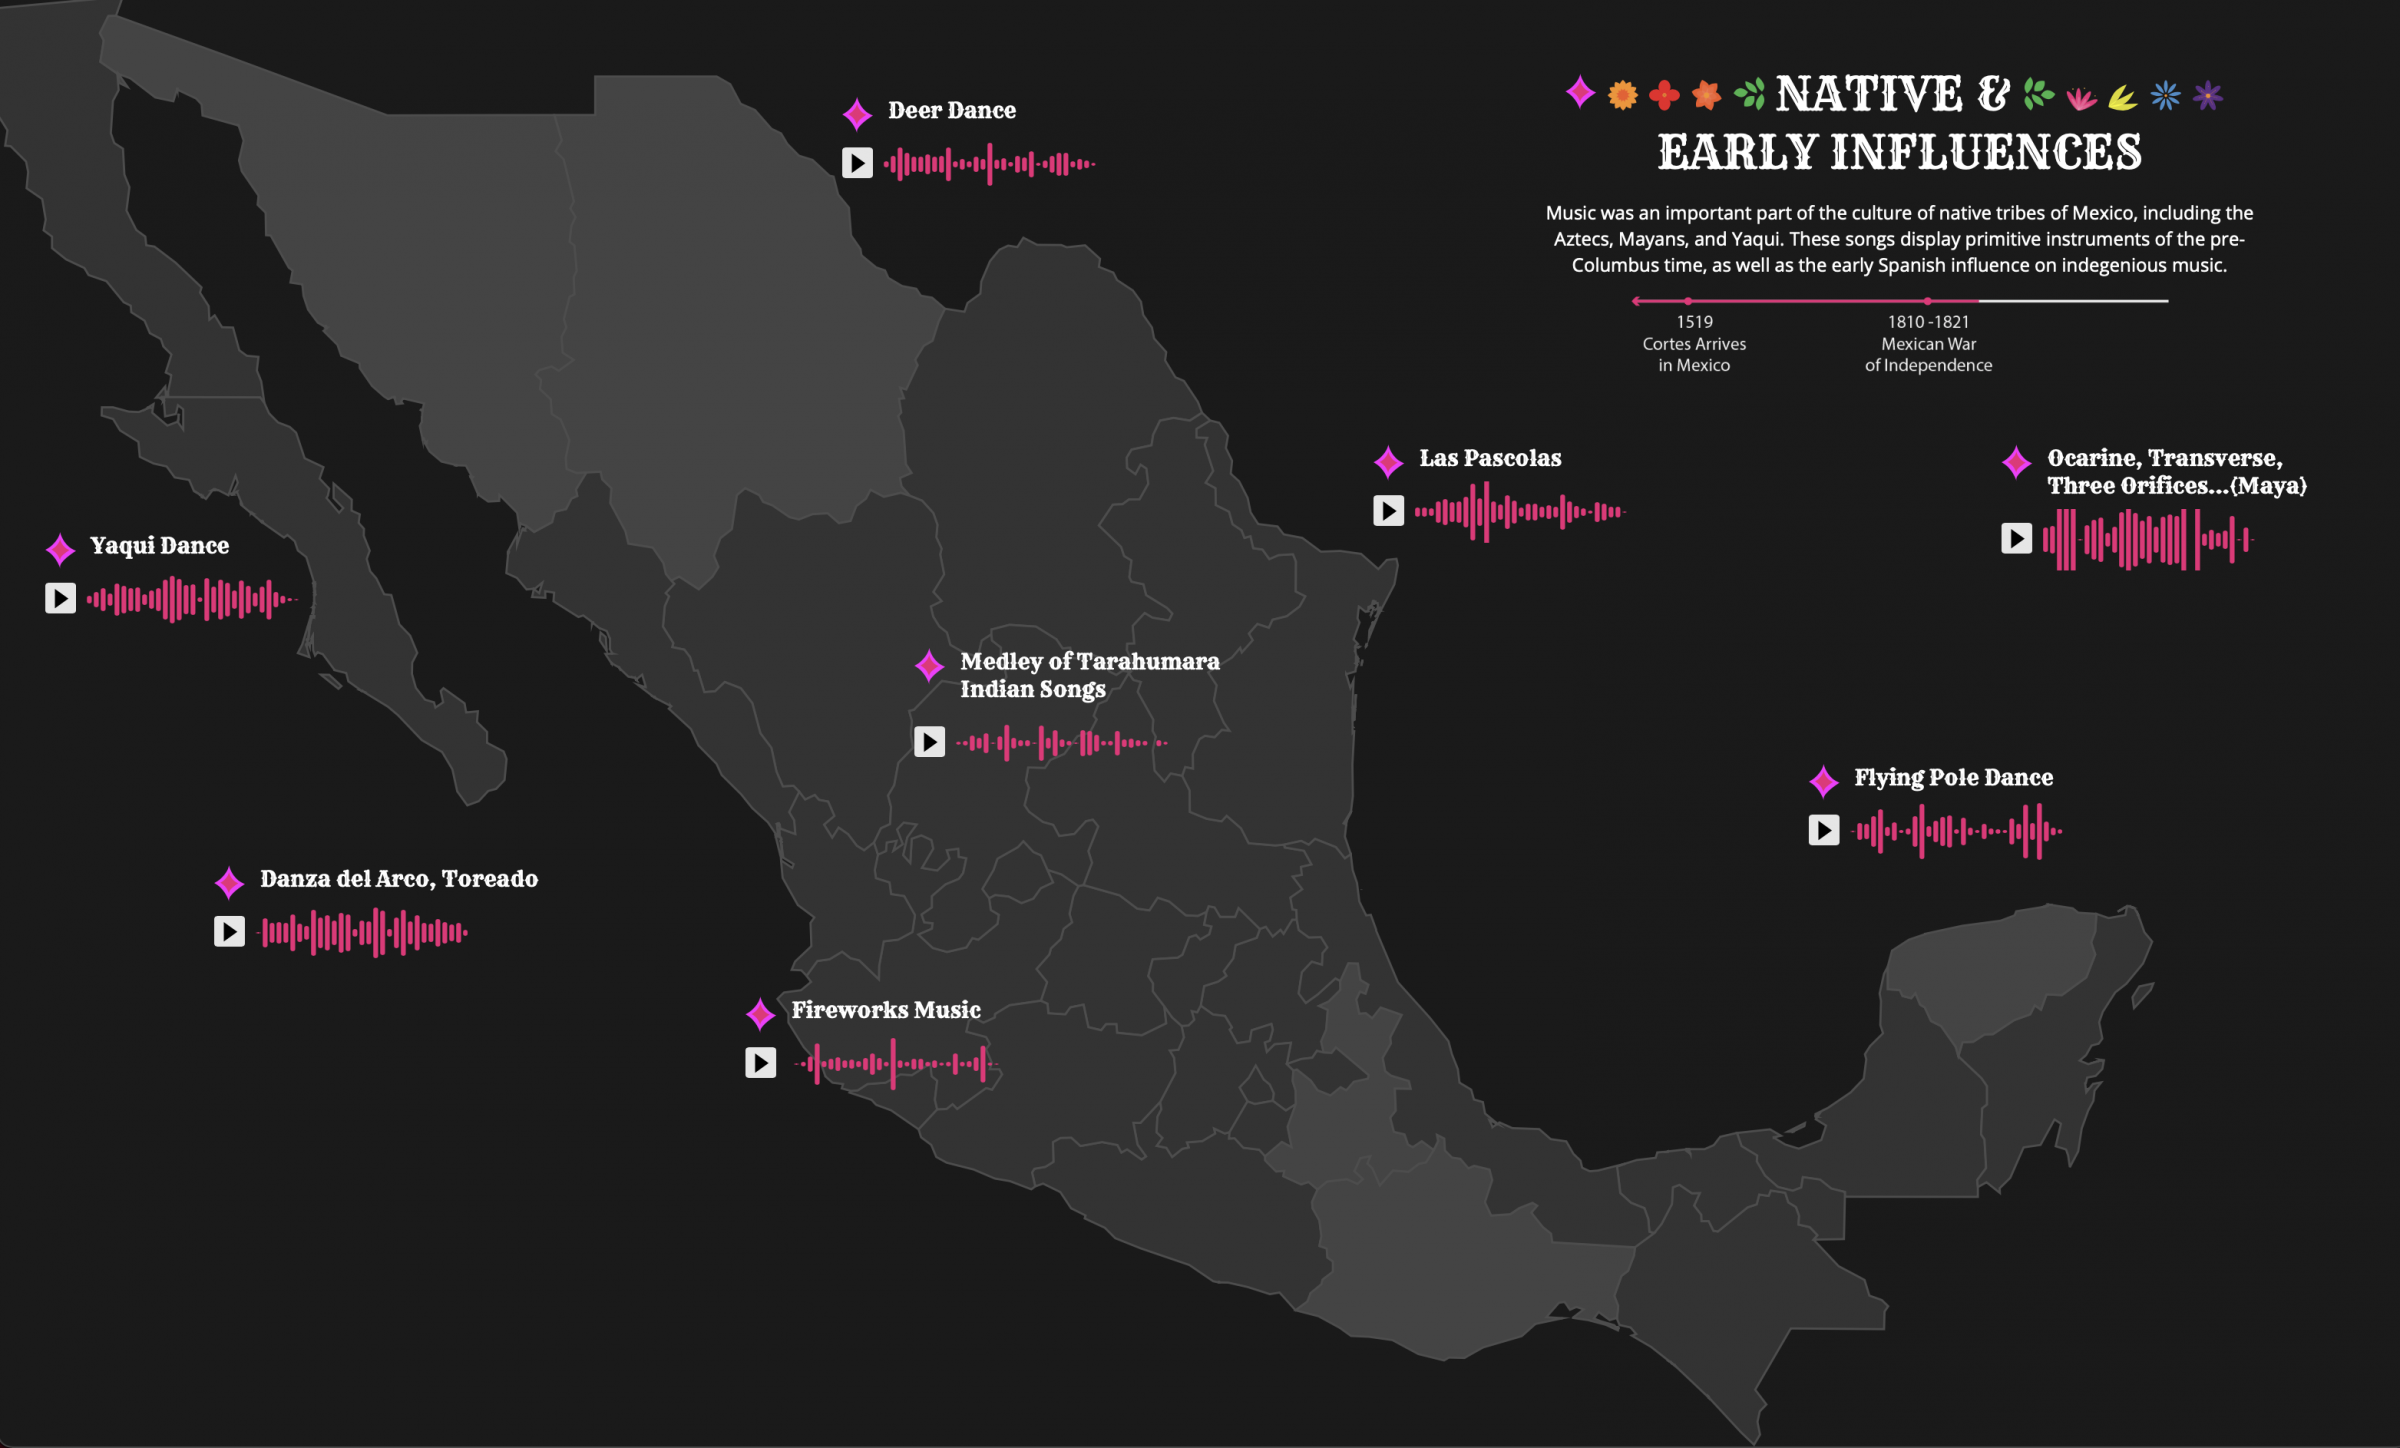
An Analysis of Topic Tagging of Posts by Gender and Folk Music of Mexico by Tiffany France. The first project highlights the important conversation on gaps in representation in the collections. The second interactive is a beautiful spotlight on Smithsonian Folkways Recordings and the use of audio as a learning tool.
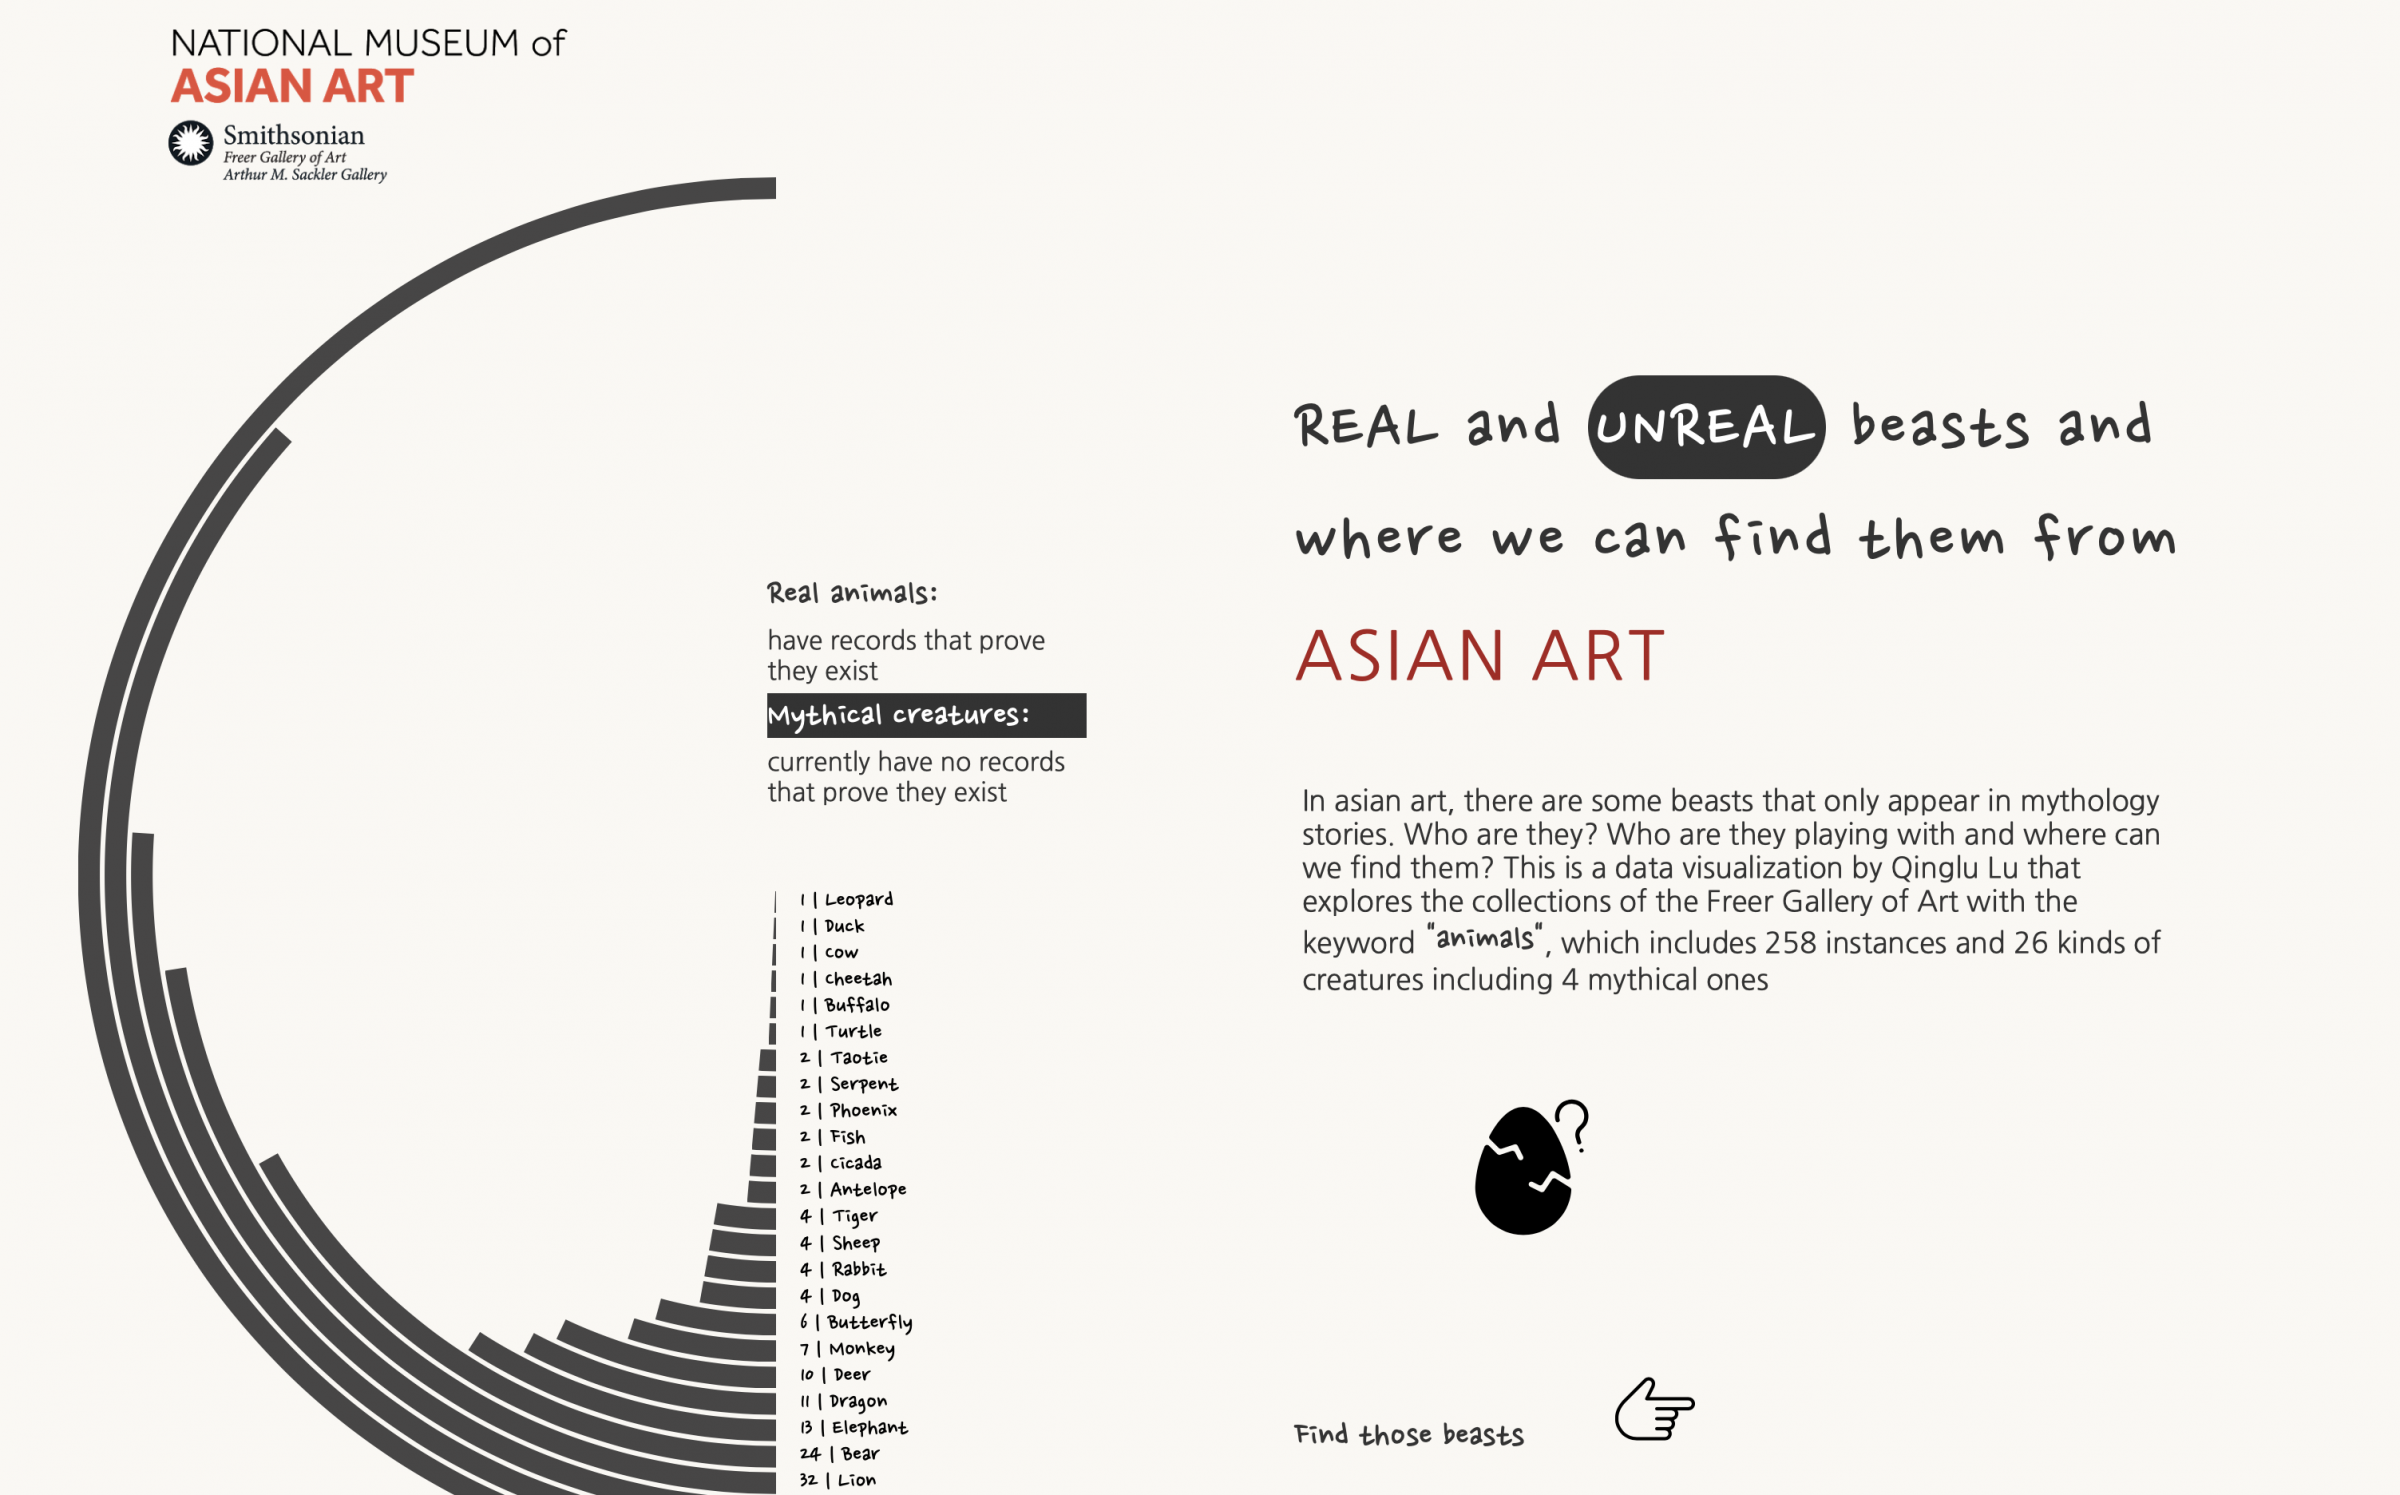
Real and Unreal Beasts and where we can find them from Asian Art by Qinglu Lu is a playful online feature and in-gallery interactive depicting animals, both real and imagined, represented in the Smithsonian National Museum of Asian Art collection.
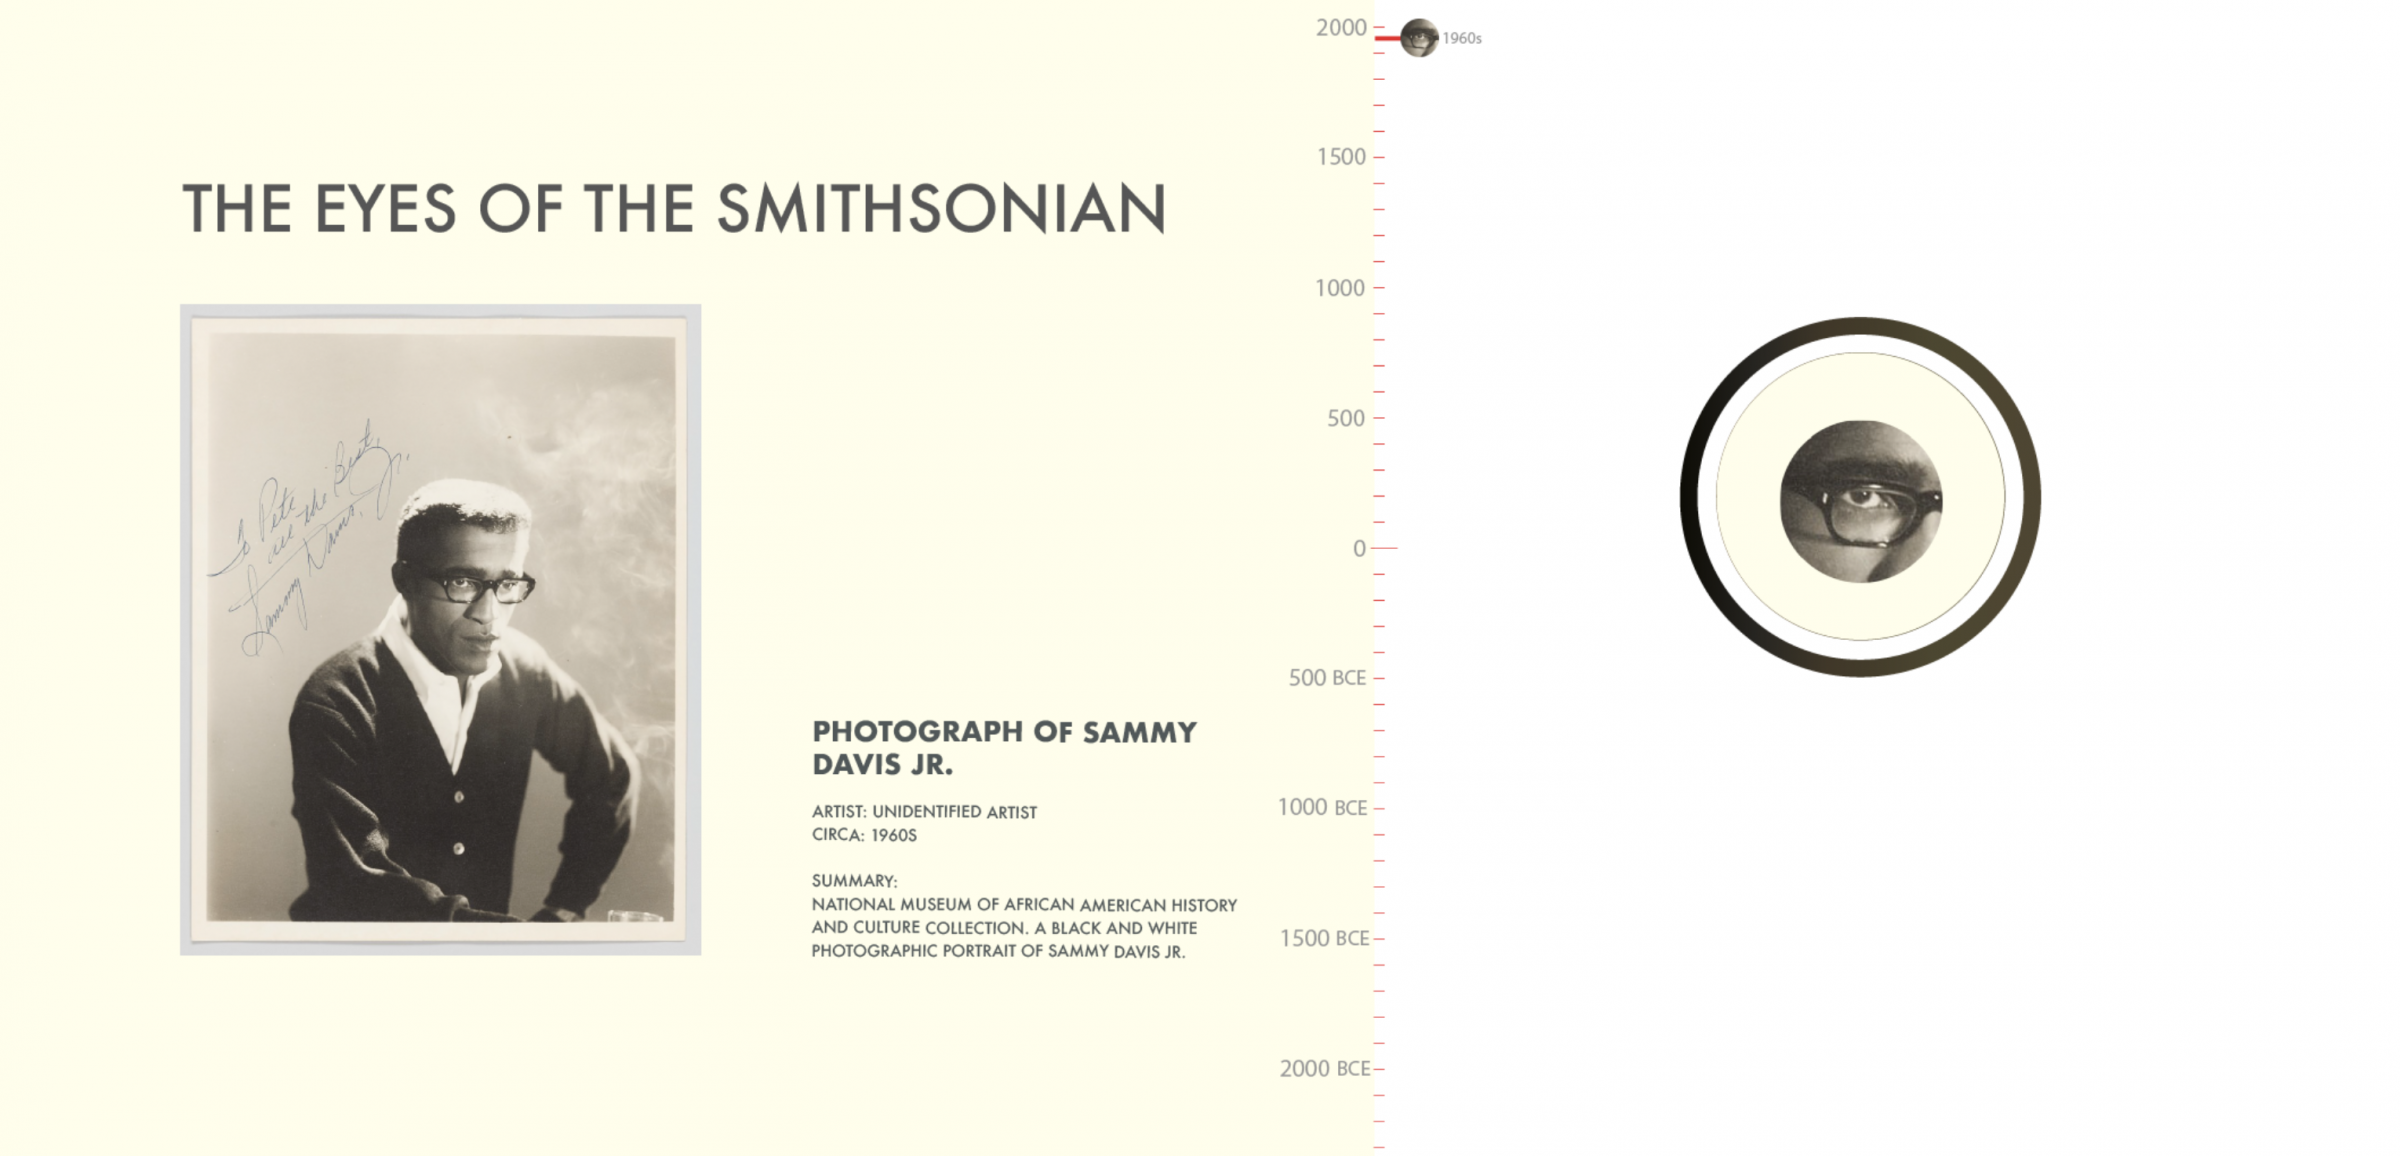
The Eyes of the Smithsonian by Lee Kuczewski is a close looking activity connecting objects from across the Smithsonian by focusing on the eyes of subjects in images.
“When one provides data visualizers access to 175 years of archiving and collecting history, across 3 million objects and 19 museums, interesting questions emerge. Some of those questions raise discussions around the inequities of underrepresented communities, or the complicated histories of object ownership, while others a platform for discovery and experimentation. I’m very fond of experiments, as they often create the conditions for conversational learning. All one has to do is look at any one of these 3 million objects to find insights and inspiration to fuel the adventures of exploring.” - Lee Kuczewski
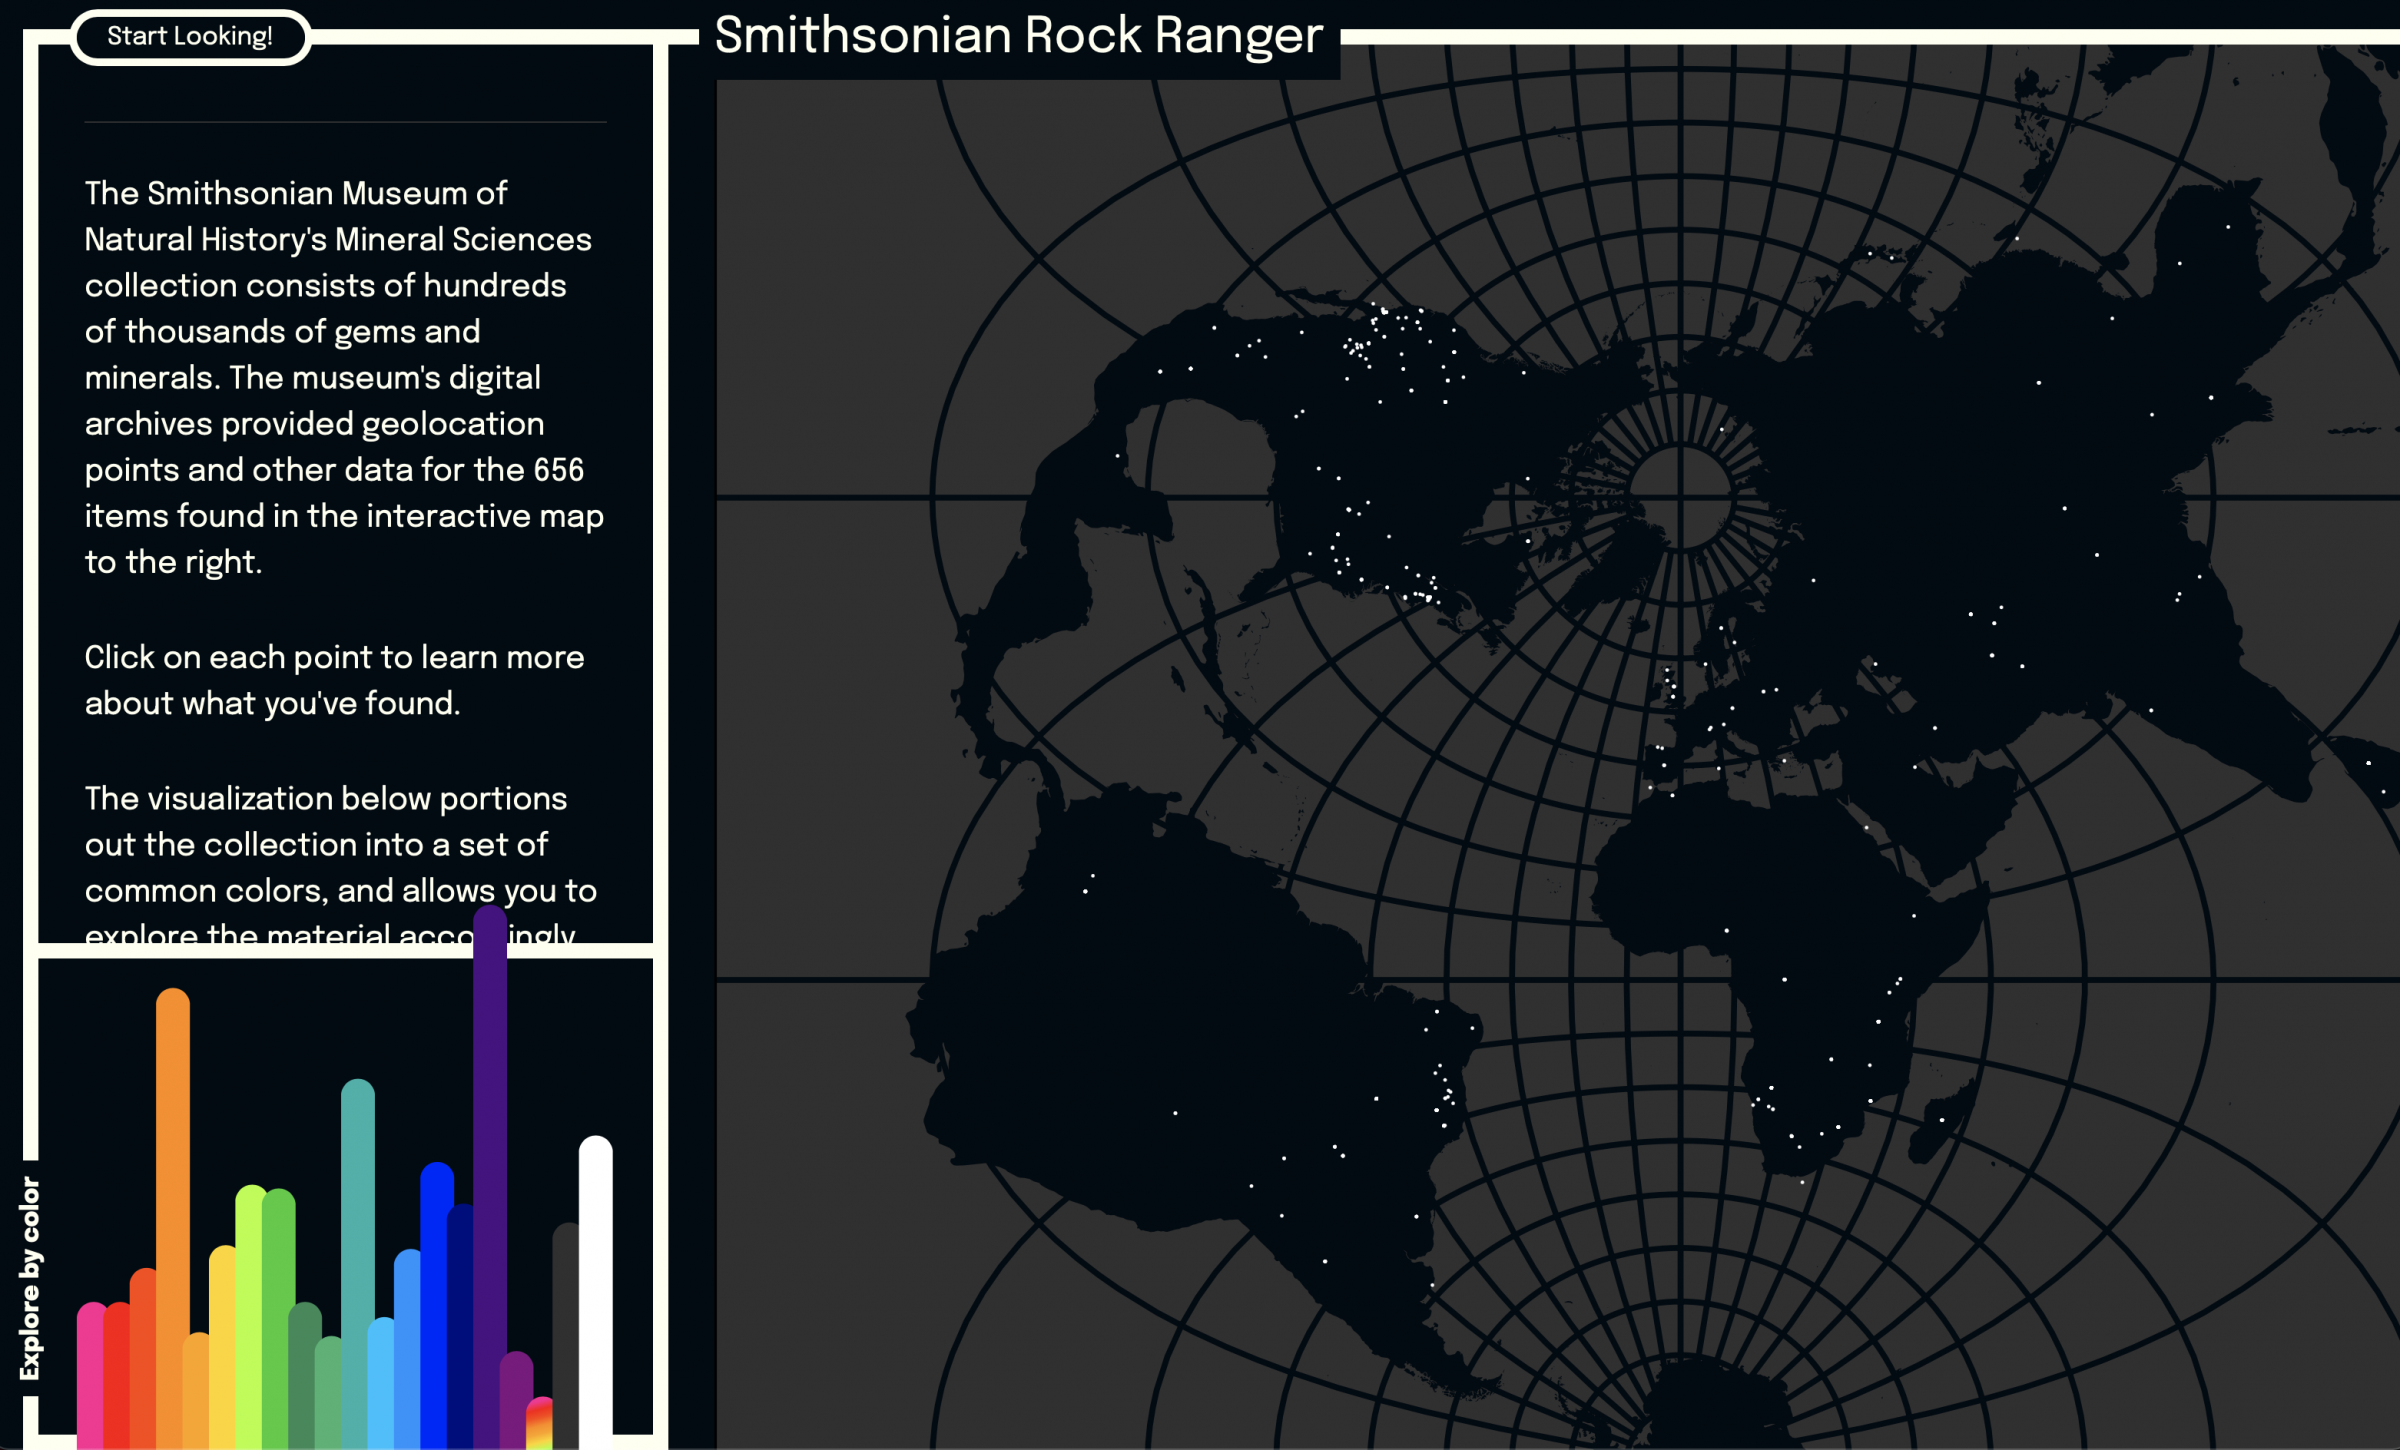
Smithsonian Rock Ranger by James Troxel gamifies gemology. Not only useful in class settings, the project is also a fun use of the Smithsonian API.
We hope you enjoyed seeing Smithsonian Open Access in use and that it sparks your imagination on how our assets and data can be creatively remixed.
The Smithsonian is grateful to the Parsons students and their clever projects, to Richard The for his vision and coordination of the collaboration, and to all of the Smithsonian staff who helped provide feedback along the way.
About Smithsonian Open Access
Smithsonian Open Access launched in February 2020, releasing 2.8 million 2D and 3D images, metadata, and research data sets into the public domain to further the Smithsonian’s mission for “the increase and diffusion of knowledge” and strategic goal of reaching “1 billion people a year with a digital-first strategy.” This includes images and data from across the Smithsonian’s 19 museums, nine research centers, libraries, archives, and the National Zoo. You can download, share, and reuse millions of the Smithsonian’s images—right now, without asking.
About Parsons Data Visualization Program
The Parsons Data Visualization graduate program brings together design, statistics, and computer science, developing critical abilities and facility for innovation in work settings in which data increasingly shapes opinion, policy, and decision-making.
Authors:
- Richard The, Assistant Professor of Interaction Design, Parsons School of Design & Creative Director, Studio TheGreenEyl
- Effie Kapsalis, Senior Digital Program Officer in the Smithsonian’s Office of the Undersecretary for Museums and Culture
- Ryan King, Program Manager for the Smithsonian Open Access initiative
* header image credit: “Defining Culture,” by Justin Kraus